How to sell bread with quantile regression
Practical tips for when and how to use quantile regression in machine learning
You’ve been hired as a data scientist at Golden Grain, the best bakery in town. Every day they deliver fresh bread to their local selling points.
Your assignment: Predict daily bread sales per selling point.
Your predecessor used mean regression, for which he was fired. The difficulty: Underestimation leads to selling points running out of bread (lost revenue). Overestimation means that there will be some bread left over (waste and costs).
Let’s see how you could leverage quantile regression in such a scenario.
Quantile regression: Train the model so that a specified percentage of the predictions are lower (or larger) than the ground truth.
I explained how best to understand quantile regression and this post is about when to use quantile regression and some random tips.
When to pick quantile regression?
Quantile regression is not for the average. And that’s why you decided to use it for bread sales. A misconception is to think that quantile regression is just for uncertainty quantification. But you can do more with it.
Robust modeling: A mean regression model predicts average bread sales. A problem with mean regression is that it’s strongly influenced by outliers since it’s based on optimizing the squared loss. Think of holidays when people buy absurd amounts of bread. Or winter days with roads too icy for customers to reach your place. But if you optimize the models for the absolute errors instead, you make it robust against outliers. This is a special case of quantile regression, also called median regression. Optimizing the pinball loss with 𝜏=0.5 for the median is equivalent to optimizing the L1 or the absolute loss.
Predicting tail behavior: Is it more expensive to deliver too much bread or too little? If the bread sells out, every subsequent customer means lost revenue. Worse, they might not even bother coming to the shop next time. Leftover bread is also a financial loss. However, it’s financially more problematic when the bread runs out since the largest cost isn’t flour, it’s rent and salaries. Therefore, you want the model to slightly overpredict the amount of bread that’s needed. So you might aim for predicting the upper quantile, say 70% instead of the mean or the median.
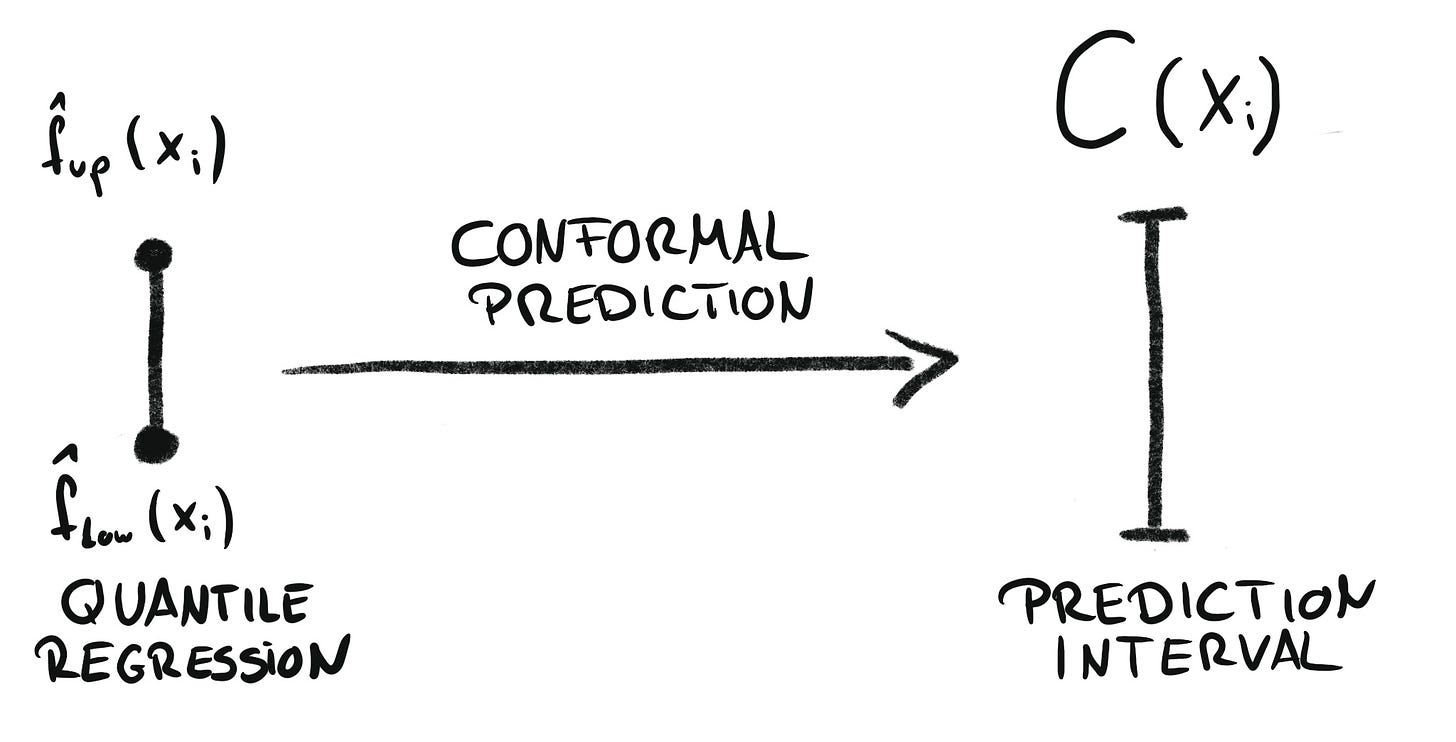
Uncertainty quantification: Golden Grain wants to better understand the uncertainty attached to bread sales per selling point. Again, you use quantile regression. You train two ML models to predict both the 10% and the 90% quantile. However, you can’t rely on these models covering 80% of the actual sales, because quantile regression is known for too low coverage. But this can be fixed with conformal prediction. The combination of both is called “conformal quantile regression” (Romano et. al 2019). This dream team is also covered in my book Introduction to Conformal Prediction With Python.
Random practical tips for quantile regression
Recently, I've been using quantile regression in a machine learning challenge that asks me to predict the 10%, 50%, and 90% quantiles of water supply forecasts in the western United States.
Here are a few random tips that helped me during the challenge:
Using quantile regression is as simple as mean regression. And your best choice when the predictions are evaluated with the pinball loss.
You have multiple options for directly optimizing the pinball loss: For example, sklearn implements linear quantile regression, you can use LightGBM and xgboost, or implement a neural network with the pinball loss.
Whenever you use multiple models for the different quantiles, an annoying problem can occur: quantile cross-over. That’s when, for example, the estimated 10% quantile is larger than the 50% quantile. Cross-over is more likely to occur if the variance for a prediction is quite low—nonetheless, not a good look. My go-to approach was for these cases to sort the quantile estimates. A very pragmatic approach. It improved the performance slightly in my case.
If undercoverage is a problem for your task you can conformalize the intervals. But since this means post-processing the predicted lower and upper quantiles, you might worsen the pinball loss. However, in my case, I conformalized the intervals and the mean pinball loss (averaged across 10%, 50%, and 90% quantiles and across the test data) remained the same.
I used the same features for all 3 quantile models. Feature importances differed, but not wildly.
I optimized the models individually, but they ended up with similar hyperparameters, so it might have worked as well to optimize a shared hyperparameter configuration. Again, that’s just an n=1 observation.


Great post as usual.
I have a question though. It seems to me that you are running different models for each quantile and therefore the quantile crossing might occur. What about the idea of Meinshausen 2006 https://www.jmlr.org/papers/volume7/meinshausen06a/meinshausen06a.pdf.
This is just running 1 model, but still being able to calculate quantiles. Any feeling of pros and cons of one approach vs the other?
Many thanks for the great work.
Joan
Great, pratical stuff as always. Sharing with my entire DS team.