
From Frequencies to Coverage: Rethinking What “Representative” Means
From Statistical Distributions to ImageNet’s 1,000 Abaci

When it comes to data and representativeness, machine learners and statisticians have different mindsets. While I covered differences in modeling in my book Modeling Mindsets, this post is about representative data.
Whether you build an image classifier or want to estimate the average rent in Bologna, you need data. But not just any data, the data should be “representative”: A dog image classifier shouldn’t only be trained on images of dogs in spooky costumes, and the Bologna dataset shouldn’t only contain apartments above restaurants.
But what exactly does “representative” mean? Let’s start with a very general definition:
A represents B if A adequately reflects the characteristics of B.
However, there are different interpretations of “reflects the characteristics”. Let’s start with the first one.
Distributional representativeness in statistics
When I studied statistics, we always talked about whether a dataset is representative of the target population. The target population is the complete set of items that you care about: rents in a city, all students of a university, all commutes done on a specific day, etc. A sample is representative when the distribution of the sample approximates the distribution of the population. Let’s call it distributional representativeness.
Distributional representativeness is central to inferential statistics since the goal is usually to draw insights about the target population from the sample. And this transfer requires that distributions match approximately. For example, I was involved in creating a rent index — basically a rent prediction model — where the sample needed to reflect the actual market situation.
You can think of distributional representativeness as preserving frequencies: For example, if you have 3 categories in your target population, say houses, apartments, and single rooms, you want the frequencies of these categories in the sample to match the target distribution. Ideally, you can preserve the frequencies of all relevant characteristics.

Category-based representativeness in ML
When I got into machine learning, I found a very different way of thinking about representativeness. Or rather, I found a lack of thinking about representativeness, at least in the distributional sense. But as I learned over the years, your classic machine learning dataset is representative, but it’s a different kind of representativeness.
ImageNet1 is an illustrative example: It’s one of the first larger datasets of images designed for training machine learning models. It comes in many versions. Probably the most famous version is ImageNet-1K, which was used in ILSVRC, a machine learning challenge that catalyzed the deep learning breakthrough in computer vision. ImageNet-1K covers ~1.28M images of dogs, abacuses, and other things. Coming from a mindset of distributional representativeness, this dataset didn’t make any sense to me. What does this dataset represent? It certainly doesn’t represent the distribution of objects in the world. What would even be a good target population for training image classifiers? All images on the internet? All photos ever taken?
Let’s take a closer look at how ImageNet was created. The original ImageNet contains 21k classes. These came from WordNet, a large lexical database of English words. The creators of ImageNet filtered down the words to only keep countable nouns that can be visually represented. For the 2012 competition (ILSVRC), this was narrowed to 1,000 non-overlapping categories, which were all leaf nodes in the taxonomy, e.g., no more “dog” but rather “Siberian husky”. Images were scraped from the web (e.g., Flickr, search engines) and then labeled by humans on Amazon Mechanical Turk. Annotators also drew bounding boxes for many images. What was left were categories such as the Siberian husky, printer, and abacus. Yes, ImageNet-1K contains about 1k images of abacuses.

While ImageNet-1K isn’t representative in terms of its distribution, it’s representative in another interpretation of “representativeness”:
Represent a wide range of categories: By starting with WordNet, the creators of ImageNet aimed for a very broad coverage of concepts. Further subsetting of concepts was done to enable learnability: only keep non-overlapping categories, and only use categories with a visual representation.
Represent each category well:
Have a diverse set of images that covers many items in the category. For example, not only Siberian husky “portraits”, but also in other angles and zoom levels.
Have enough images within each category. ImageNet contains about the same number of data points per category, regardless of the actual “importance” or “frequency” of the concept in the real world.
Let’s call this categorical representativeness. Maybe coverage-based would also be a good name, since it aims at broad coverage, “overrepresenting” rarer categories from the viewpoint of distributional representativeness.

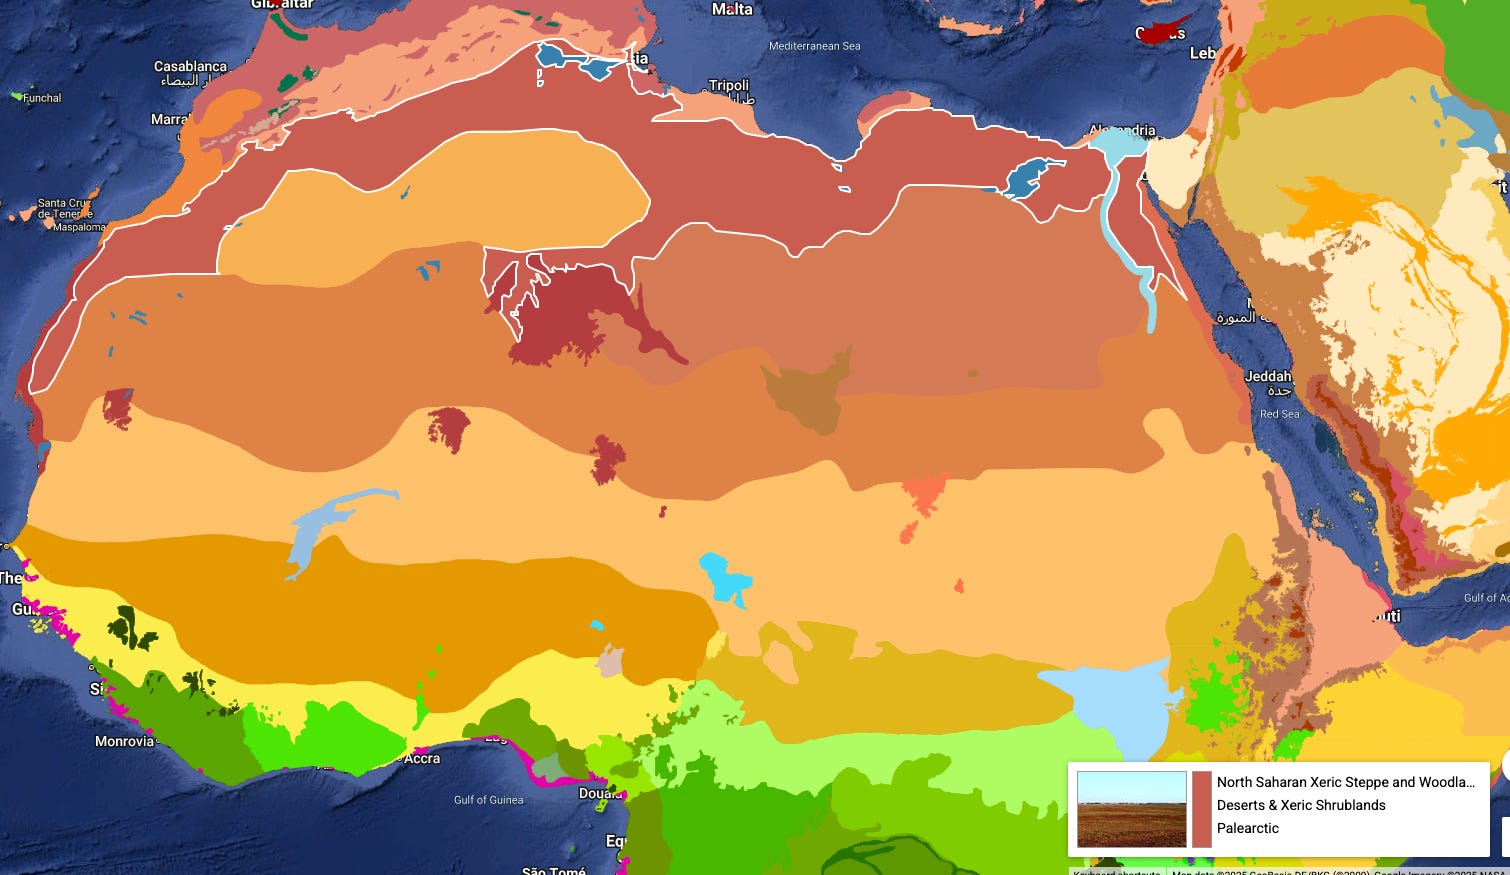
A very recent example of categorical representativeness is the training data for the AlphaEarth Foundations2 embedding model for remote sensing data. For training the model, the authors created a dataset of land and coastal locations of Earth. First, they sampled locations for which they had geo-located texts, like from Wikipedia. Next, they sampled 10k locations for each of 846 ecoregions (e.g., Himalayan Subtropical Pine Forests). Since these ecoregions are very different in size (see image), this sampling approach doesn’t yield a uniform sample from Earth. The authors’ approach to sampling is much better understood through the lens of categorical representativeness than distributional (although some aspects of their sampling process are distributionally motivated).
Btw. If you want to learn more about AlphaEarth Foundations and ML for satellite data, check out my new book project: Machine Learning for Remote Sensing.
Why categorical representativeness is common in machine learning
Why do we find categorical representativeness so often in machine learning? Why isn’t distributional representativeness the norm?
Quick note here: While categorical representativeness is common in machine learning, there are also many projects with a distributional approach. Typically associated with tabular data used in cases such as credit risk or health care.
Compared to inferential statistics, machine learning has different goals:
In inferential statistics, we want to draw conclusions about the population from a sample. Without distributional representativeness, we’d simply risk drawing wrong conclusions.
In machine learning, it’s much more task-oriented: We want a prediction algorithm that can, for example, correctly classify images. To allow the ML algorithms to learn patterns, these patterns need to be represented sufficiently in the data.
In many cases, we couldn’t even define a target population. If you are a machine learning researcher who wants to develop a general image classifier, it’s super unclear what the target population is. The same goes for many other tasks like sentiment analysis, translation, word embeddings, and image segmentation.
Machine learning is very utility- and performance-focused. Let’s assume we have a solid way of evaluating the model: who cares what the distribution of the training data looks like if we can show that the model performs well? Our evaluation will show the utility of the model, and if it’s good enough, it’s good enough. If we overrepresent rare categories, the model has a better ability to learn relevant patterns.
When categorical thinking goes wrong
Categorical representativeness is, in my opinion, responsible for many problems in machine learning.
One of my favorite examples is the myriad of COVID x-ray classification models published during the pandemic. The typical setup (simplified): Given an X-ray of a patient’s lung, classify whether this patient has COVID pneumonia or not. Many of these models were trained on similar datasets. And these datasets were cobbled together with categorical representativeness in mind: The positive cases (COVID) were collected very differently from the negative cases (non-COVID). This led to many problems, such as the non-COVID dataset containing x-rays of children’s lungs, but not the COVID cases. In short, the models could get better performance by predicting which dataset an image belongs to instead of learning relevant patterns. There were many more problems, such as duplicates and unverified data, but that goes beyond today’s topic. The stark difference in the data-generating process between positive and negative samples alone was sufficient to free the models from the shackles of clinical utility.
Another problem arises from categorical representativeness: Since the training data no longer reflects distributional realities, you may have overrepresentation of small categories and underrepresentation of large categories. This causes problems with calibration, meaning the “probabilities” of classifiers do not really reflect actual probabilities. Also, other measures of uncertainty, like prediction intervals, become problematic.
If you are using machine learning with the goal of drawing scientific conclusions from your model about the world, you also might want to have distributional representativeness: The data should represent the target population to support your claims, as Timo and I describe in our book Supervised ML for Science in the chapter about Generalization.
I also think of categorical representativeness as the motivator behind techniques such as SMOTE, which I covered some time ago:

I basically argue that SMOTE destroys any distributional representativeness that you might have had in your data.
Would machine learning be better off with distributional representativeness?
You need distributional representativeness whenever you want to draw conclusions about a general population. A point where this occurs in practically any machine learning project is the evaluation part. If the test data doesn’t represent, in the distributional sense, the application data, all the performance metrics are unreliable and are just mere pointers. Therefore, wherever and whenever possible, the test data should represent the distribution of the application data. In this sense, the application data is the target population. This is, of course, difficult to anticipate in many cases. Perhaps you are developing a classifier for an app and don’t have actual user data yet.
On a more meta-level, the same applies to benchmarks. When someone says ML algorithm A is better than B, then it’s typically because A was, on average, better on a set of prediction tasks on various datasets. If you just say A was better than B on these specific datasets, fine. But typically, this finding is extrapolated, and people assume that A is, in expectation, better than B also for other datasets. But for this interpretation, we kind of assume that the “dataset of datasets,” aka the benchmark, somehow represents the distribution of datasets in the wild. Anyone working with real data knows that datasets in benchmarks do not typically represent actual datasets, since benchmark datasets are usually much cleaner, often without missing values, and many of them are of a simpler nature.
While we may want distributional representativeness for the evaluation, we can be much more relaxed when it comes to the training data. Whether or not up- or downweighting certain categories is good or bad, we can test as long as we have distributional representativeness in the validation set. Also, when it comes to calibrating the models, e.g., with conformal prediction, you need distributional representativeness for the calibration, or otherwise your coverage guarantees won’t hold.
For general-purpose and foundational models such as the ones trained on ImageNet or AlphaEarth, distributional representativeness is not a requirement. Simply because these are base models, and you would typically fine-tune them or train a new model based on the embeddings. For such base models, distributional representativeness is just a “downstream concern”.
Conclusion: Categorical representativeness works well for training, especially for base models. For evaluation, you need distributional representativeness to ensure reliable metrics and calibration.
Deng, Jia, Wei Dong, Richard Socher, Li-Jia Li, Kai Li, and Li Fei-Fei. "ImageNet: A Large-scale Hierarchical Image Database." 2009 IEEE Conference on Computer Vision and Pattern Recognition (CVPR), June 2009, pp. 248–255. IEEE. doi:10.1109/CVPR.2009.5206848.
Brown, Christopher F., et al. "AlphaEarth Foundations: An embedding field model for accurate and efficient global mapping from sparse label data." arXiv preprint arXiv:2507.22291 (2025).
Hey Christoph - this puts into words some of the tensions I've felt. Fantastic thinking. A case study on the effects of categorical vs distributional sampling on calibration and model ranking/selection would be fascinating.